#PowerJanta – Power BI March 2021 Feature Summary
#PowerJanta - Important and most relevant features from Power BI March 2021 Feature Summary as per Saurabha Joglekar, BI Consultant.
#PowerJanta – Power BI March 2021 Feature Summary
Microsoft launched its Power BI March 2021 Feature Summary last week. Here is my selection of noteworthy highlights in Power BI Desktop.
Reporting
- DirectQuery for PBI datasets and Azure Analysis Services
- Noteworthy changes here since Dec 2020, you can now connect to PBI dataset from DQ.
- We can now do Chaining of PBI Datasets, essentially using multiple PBI datasets in one report.
- New Selection Controls in Azure Maps Visual
Analytics
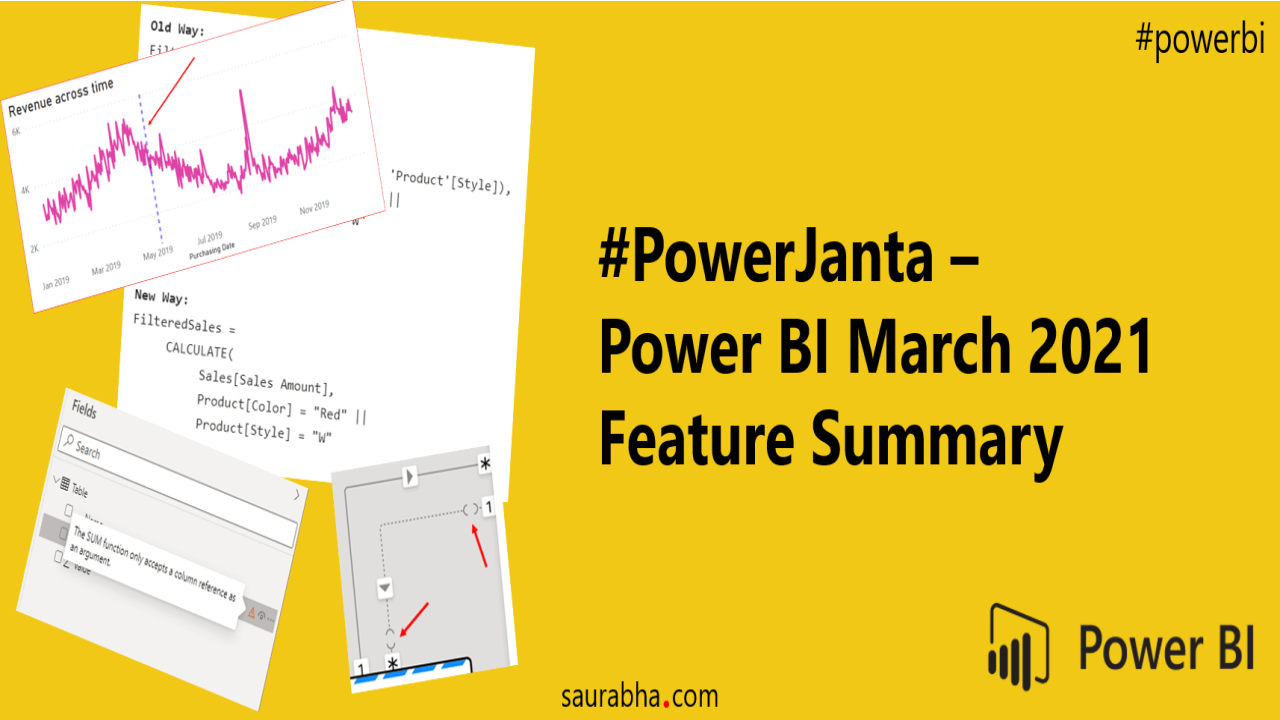
- X-axis constant line for line charts
- Something that was needed for a long time
Modelling
- New icon for Limited Relationships
- A Limited Relationship is a relation between 2 different data sources. We can now identify it directly via the icon
- Error Icon Tooltips
- If you create a measure with an error and save it. It will now show a tooltip displaying that error with a red triangle icon next to that measure.
DAX
- EAGER
- This is like a more optimized version of IF, it is useful when you have a measure in the condition as well expression part. Check the example below.
- Here [Total Sales] or [Last Month Sales] will be evaluated 2 or 3 times, once in the condition and then again in the TorF expression.
- EAGER avoids these evaluations thus enhancing the performance. But, MS recommends that one should not simply use this instead of IF unless one has a specific requirement or performance issues.
Sales = IF ( [Total Sales] > [Last Month Sales], [Total Sales], [Last Month Sales]-[Total Sales] )
- CALCULATE
- This is something that we all have been waiting for.
- Remember the time when you wanted a sum based on two filters and thought of using CALCULATE but ended up writing a lot more using FILTER() and ALL()
- Now you can simply do it using CALCULATE. Whether this change will affect the DAX lineage in any is something we will have to wait and watch.
Old Way:
FilteredSales =
     CALCULATE(
          Sales[Sales Amount],
          FILTER(
             ALL( 'Product'[Color], 'Product'[Style]),
             'Product'[Color]="Red" ||
             'Product'[Style]="W"
          )
     )
New Way:
FilteredSales =
     CALCULATE(
          Sales[Sales Amount],
          Product[Color] = "Red" ||
          Product[Style] = "W"
     )
If you like this content or want me to stress on something, feel free to reach out to me at me@saurabha.com with your comments, suggestions and feedback.
Check out my previous post titled #PowerJanta – Power BI February 2021 Feature Summary. To know more about #PowerJanta, click here.
Image Credits: Microsoft’s Official Power BI March 2021 Feature Summary.
Related Articles
#PowerJanta – Power BI May 2023 Feature Summary
#PowerJanta - Important and most relevant features from Power BI August 2021 Feature Summary as per Saurabha Joglekar, BI Consultant.

#PowerJanta – Power BI October 2021 Feature Summary
#PowerJanta - Important and most relevant features from Power BI October 2021 Feature Summary as per Saurabha Joglekar, BI Consultant.
#PowerJanta – Power BI August 2021 Feature Summary
#PowerJanta - Important and most relevant features from Power BI August 2021 Feature Summary as per Saurabha Joglekar, BI Consultant.
Enjoyed this article?
Get in touch, or explore more of my writing on Power BI, AI & data and automation.